Sentry sink
If you are using Sentry for error monitoring, you can use the Sentry sink to send log messages to Sentry using @logtape/sentry package:
deno add jsr:@logtape/sentrynpm add @logtape/sentrypnpm add @logtape/sentryyarn add @logtape/sentrybun add @logtape/sentryNOTE
For Deno, you need both @sentry/deno and @sentry/core at the same version (e.g., both at 9.41.0) due to Sentry's exact version pinning.
Basic usage
The quickest way to get started is to use getSentrySink() without any arguments:
import { configure } from "@logtape/logtape";
import { getSentrySink } from "@logtape/sentry";

await configure({
  sinks: {
    sentry: getSentrySink(),
  },
  loggers: [
    { category: [], sinks: ["sentry"], lowestLevel: "debug" },
  ],
});
By default, only error and fatal level logs are captured as Sentry events.
Trace correlation
This feature is available since LogTape 1.3.0.
When using Sentry's performance monitoring, logs automatically correlate with active traces and spans. This happens with zero configuration:
import * as Sentry from "@sentry/node";
import { getLogger } from "@logtape/logtape";

const logger = getLogger("app");

Sentry.startSpan({ name: "process-order" }, () => {
  logger.info("Processing order", { orderId: 123 });
  // Log automatically includes trace_id and span_id
});
The trace context (trace_id, span_id, parent_span_id) is automatically captured from active Sentry spans and included in all logs, breadcrumbs, and events.
Breadcrumbs
This feature is available since LogTape 1.3.0.
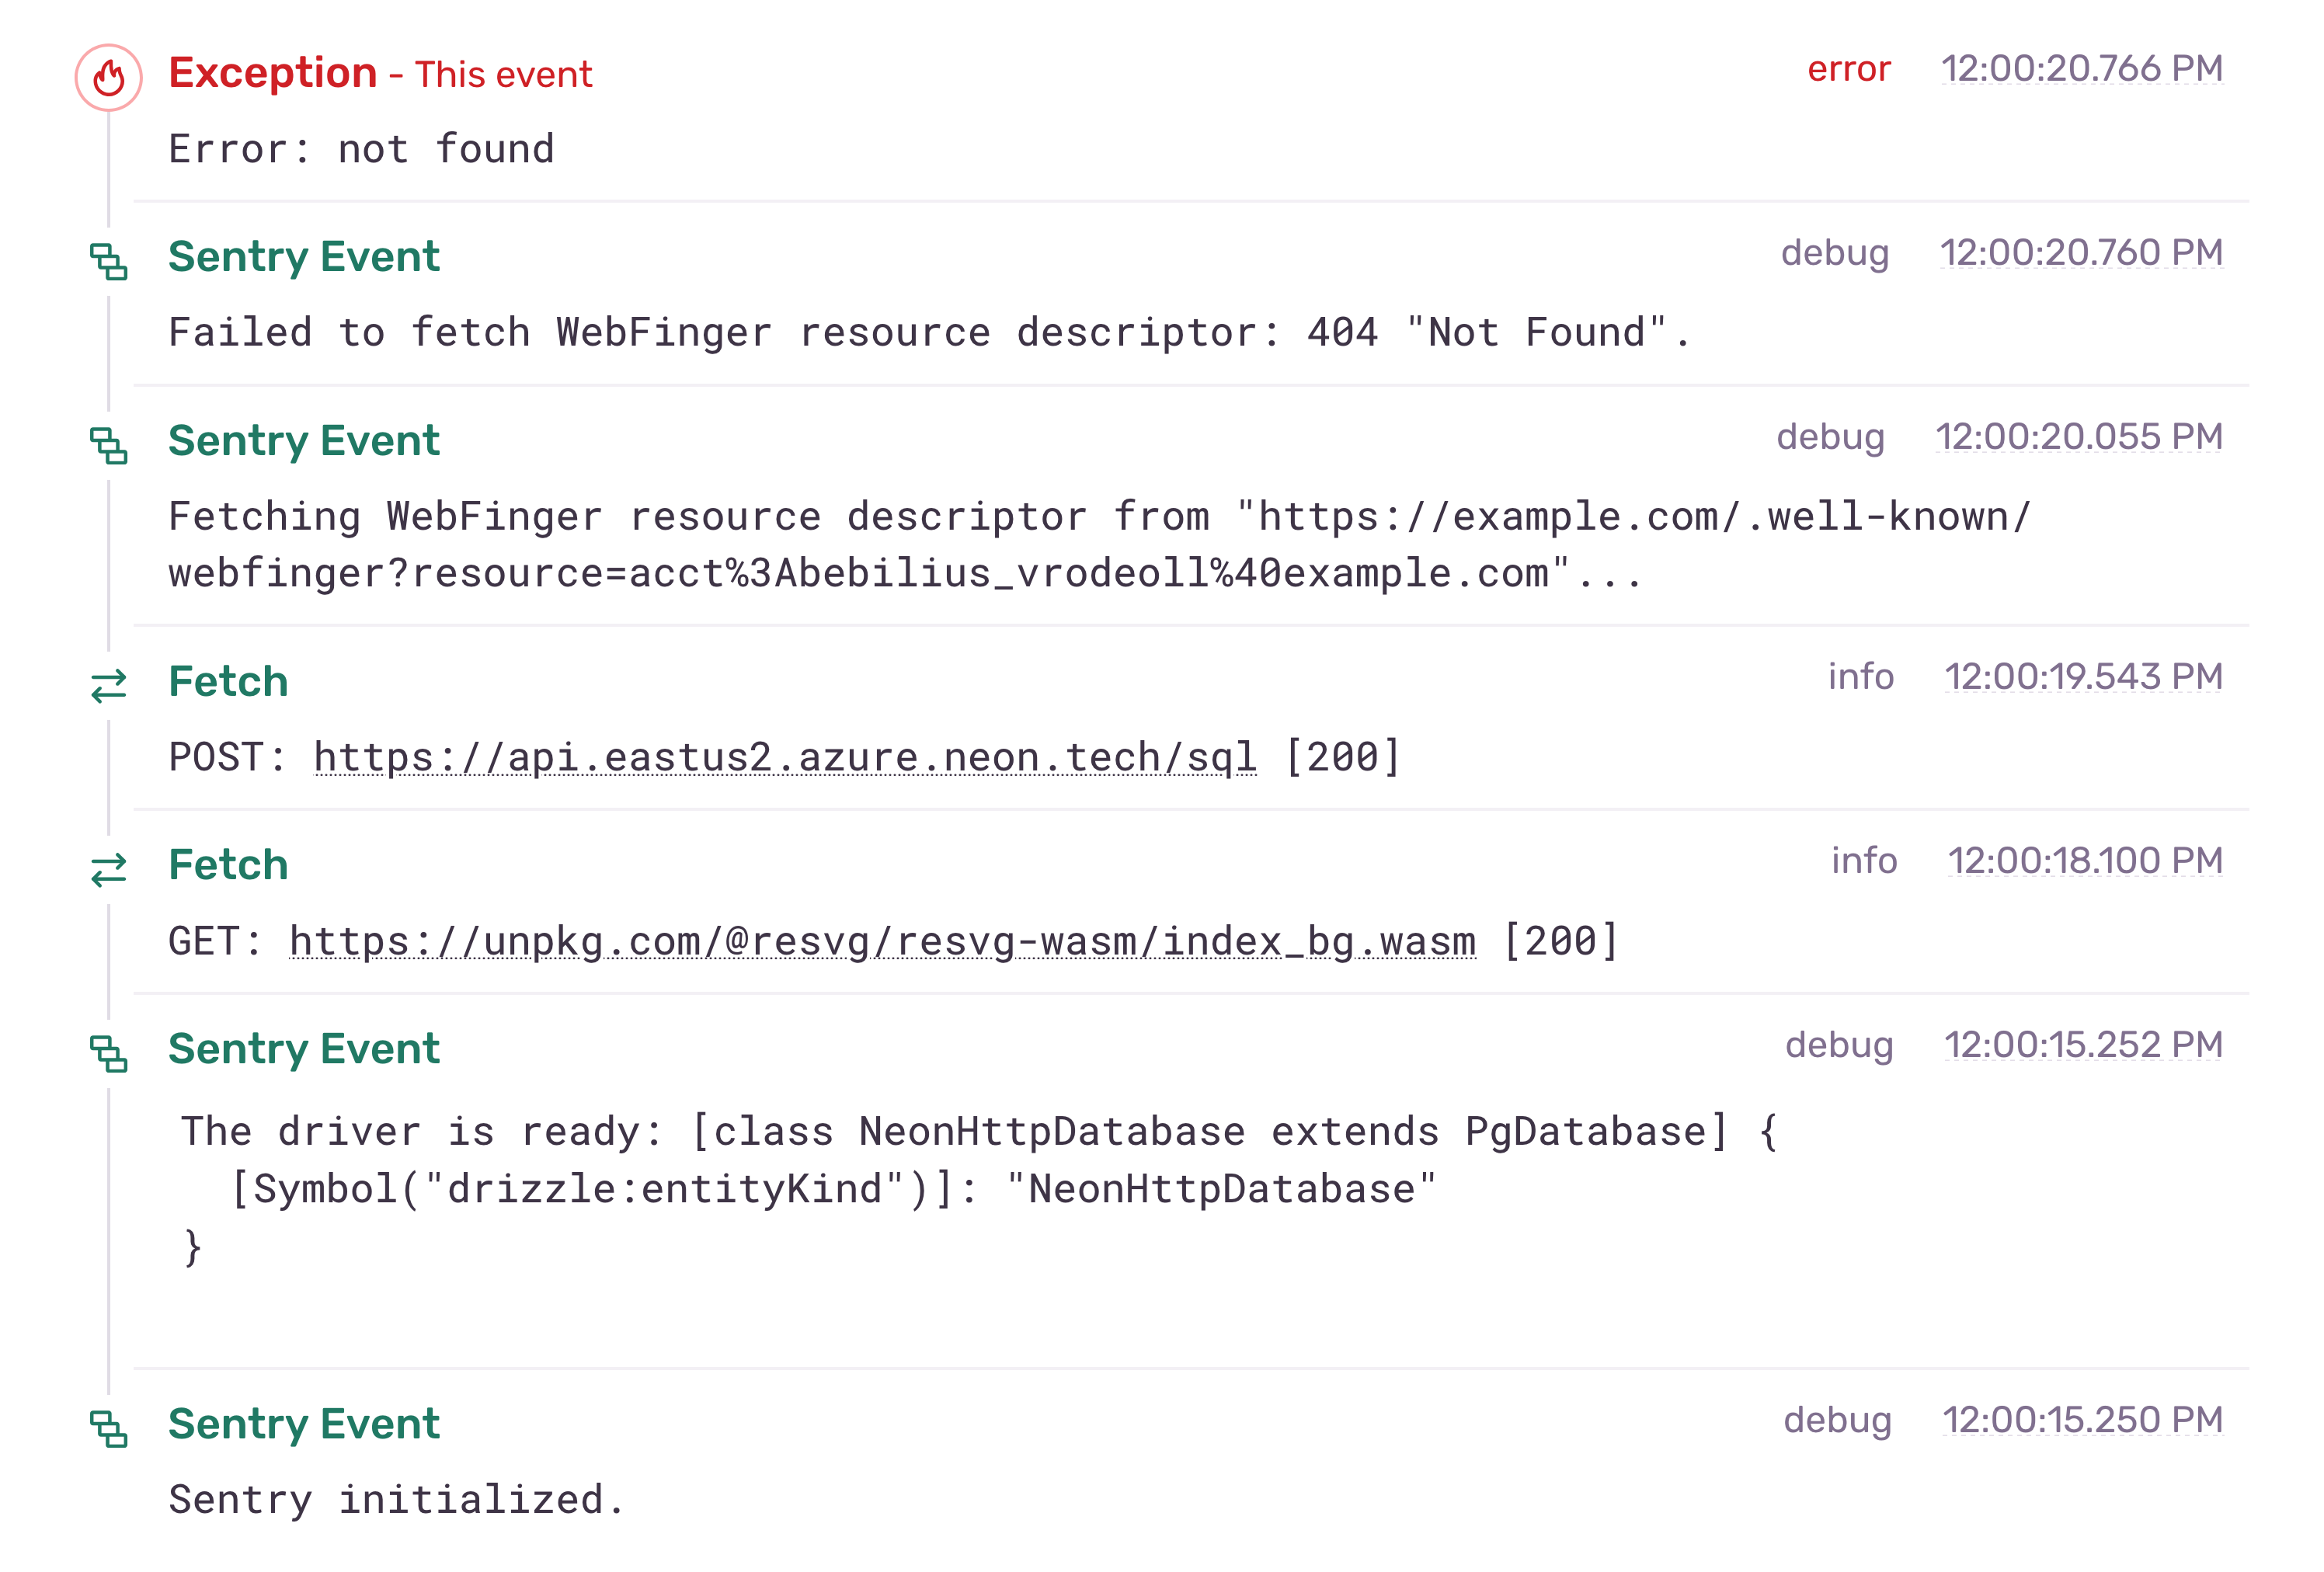
You can enable breadcrumbs to create a debugging context trail that shows what happened before errors:
import * as Sentry from "@sentry/node";
import { configure } from "@logtape/logtape";
import { getSentrySink } from "@logtape/sentry";

Sentry.init({ dsn: process.env.SENTRY_DSN });

await configure({
  sinks: {
    sentry: getSentrySink({
      enableBreadcrumbs: true,
    }),
  },
  loggers: [
    { category: [], sinks: ["sentry"], lowestLevel: "info" },
  ],
});
When enabled, all log levels become breadcrumbs in Sentry, providing complete context for debugging. Use LogTape's lowestLevel to control which logs reach the sink.

Structured logging
This feature is available since LogTape 1.3.0 (requires Sentry SDK 9.41.0+).
Send structured, searchable logs using Sentry's Logs API:
import * as Sentry from "@sentry/node";
import { configure } from "@logtape/logtape";
import { getSentrySink } from "@logtape/sentry";

Sentry.init({ dsn: process.env.SENTRY_DSN, enableLogs: true });

await configure({
  sinks: {
    sentry: getSentrySink(),
  },
  loggers: [
    { category: [], sinks: ["sentry"], lowestLevel: "debug" },
  ],
});
The sink automatically detects when the Logs API is available (SDK 9.41.0+ with enableLogs: true) and uses it for structured logging. When unavailable, logs are sent as events and breadcrumbs only.
Filtering and transformation
This feature is available since LogTape 1.3.0.
You can use beforeSend to filter or transform log records before they are sent to Sentry:
import * as Sentry from "@sentry/node";
import { configure } from "@logtape/logtape";
import { getSentrySink } from "@logtape/sentry";

Sentry.init({ dsn: process.env.SENTRY_DSN });

await configure({
  sinks: {
    sentry: getSentrySink({
      beforeSend: (record) => {
        // Filter out debug logs
        if (record.level === "debug") return null;

        // Redact sensitive data
        if (record.properties.password) {
          return {
            ...record,
            properties: { ...record.properties, password: "[REDACTED]" }
          };
        }

        return record;
      },
    }),
  },
  loggers: [
    { category: [], sinks: ["sentry"], lowestLevel: "debug" },
  ],
});
Returning null from beforeSend drops the log record entirely.
Event capture
This feature is available since LogTape 1.3.0.
All error and fatal level logs create Sentry Issues. If the log contains an Error instance in its properties, captureException is used for better stack traces. Otherwise, captureMessage is used:
import { getLogger } from "@logtape/logtape";

const logger = getLogger(["my-app"]);

// Creates Issue with stack trace (uses captureException)
logger.error("Database connection failed", { error: new Error("timeout") });

// Creates Issue without stack trace (uses captureMessage)
logger.error("User not found: {userId}", { userId: 123 });

// Does NOT create Issue - goes to structured logs and/or breadcrumbs only
logger.info("Request received", { path: "/api/users" });
All logs are sent to Sentry's structured logging (when enableLogs: true) and can become breadcrumbs (when enableBreadcrumbs: true), providing full context when errors occur.
For more details, see the getSentrySink() function and SentrySinkOptions interface in the API reference.